Data Analyst
13-03-2025
Completado
Power BI
Figma
Tabular Editor
README.md
Ver en GitHub📊 Logistics and Revenue Insights
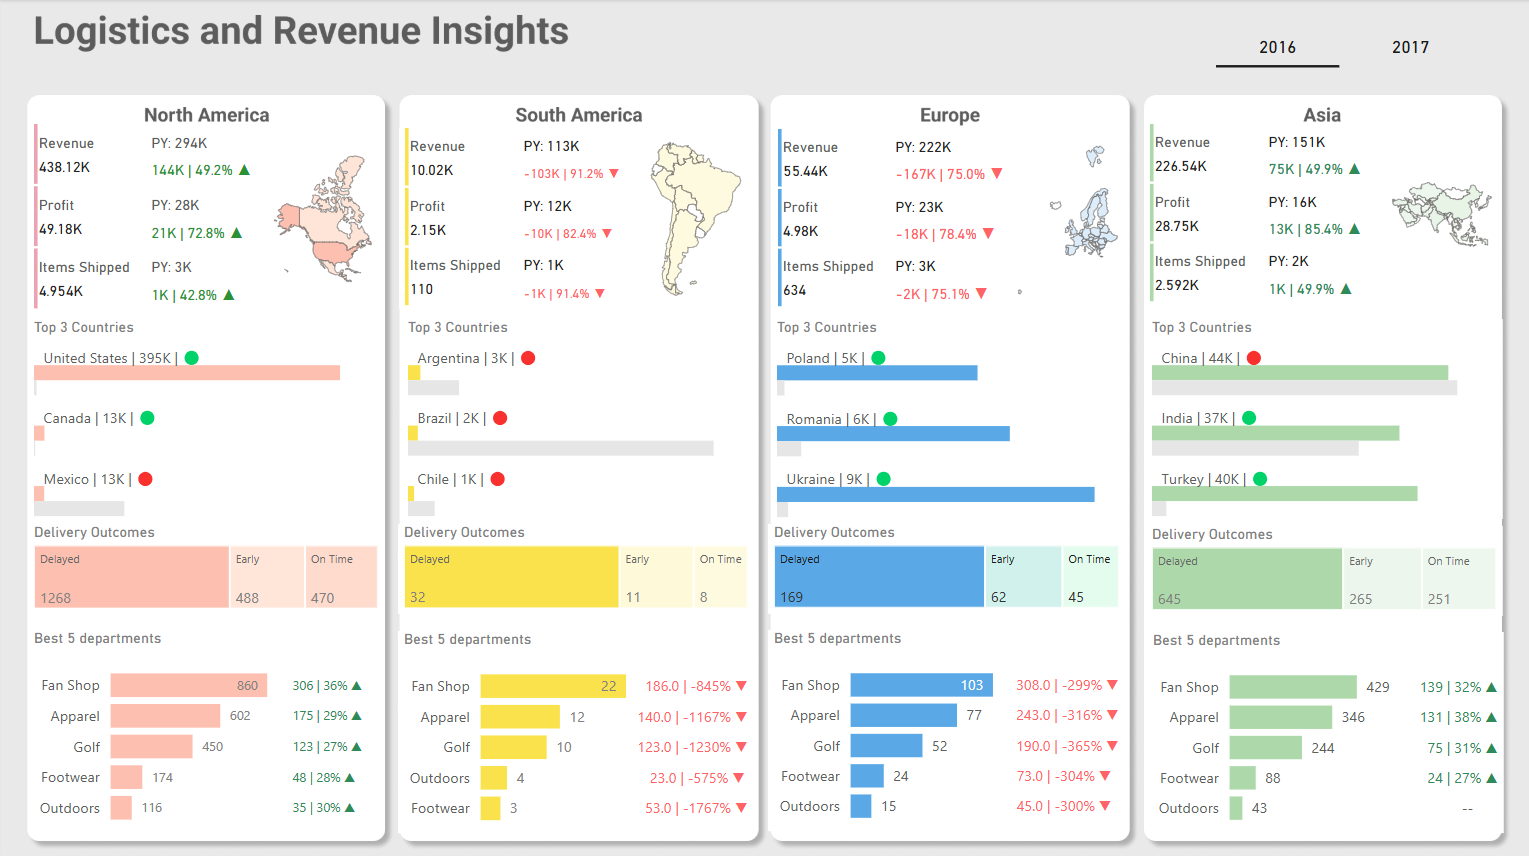
A Power BI dashboard focused on logistics and revenue insights across different regions. This project was inspired by a LinkedIn post from Injae Park and built using historical data from Kaggle.
🌍 Features
- Revenue and profit analysis across four regions
- Top-performing countries and departments
- Delivery performance tracking (On-time, Early, Delayed)
- Interactive visualizations with maps
🎨 Design
- Background: Figma Design
- Color Palette: Figma Colors
#808080 |
|
#E6E6E6 |
|
#2E8B57 |
|
#FF6366 |
|
#FFE6D9 |
|
#FDBFAF |
|
#E4FCED |
|
#5AA9E6 |
|
#FEFAE0 |
|
#FAE24C |
|
#EEF7EE |
|
#ACD8AA |
🛠 Tools & Resources
- Kaggle datasets (data) for historical data (2016-2017)
- Tabular Editor to replicate measures across regions
- GeoJSON Maps (geojson-maps.kyd.au) for custom map visuals
📌 Limitations
- Russia was excluded due to space constraints
- Africa was not included in this version
Contenido sincronizado automáticamente desde GitHub